
 6701
6701
Enhanced Symbol Library
Released June, 2015
Before release 5.0, Dimension supported a small set of standard symbols plus the ability to add a collection of additional symbols. Adding a collection was NOT user-friendly. The symbols are stored as 32×32 monochrome bitmaps. They are drawn using the point color.
Release 5.0 adds these enhancements:
- There is now an option in the Settings tab to edit point symbols. It displays a list. You can Edit, Clone or Delete a points symbol. (The eTakeoff provided symbols can’t be deleted.)
- There’s also a button to “Drag New”. If you press this, you can drag a symbol from the current drawing, then edit it and add it to the point symbols.
Trace Enhancements
Leader Line
An option was added to draw a leader line from a measurement point to the description/quantity display. One end of the line would be a measurement point. By default that is the first point. If you right-click on a point, there is a context menu option “Draw leader to this point”. The second point of the leader would be:
- The center of the left edge of the text if the leader point was left of the description
- The center of the right edge of the text if the leader point was right of the description
- The center of the bottom edge of the text if the leader point was directly below the description
- The center of the top edge of the text if the leader point was directly above the description
- If the leader point is inside the text, the leader will not be drawn.
Text Color
Prior to release 5.0 the point color was used to draw point symbols, point text and the description/quantity display. Now a separate color button has been added for the point text and description/quantity display. This would be used to draw the text at each point, the description/quantity text and the leader line.
Arc between Points
You can now display run measurements with arcs for the lines between the points. (The “Create Arc” functionality wouldn’t work because you don’t want intermediate points.) A new Trace property is a “Curved” checkbox. If this is checked the lines will be drawn with the default arc (Drawing tab of the User Preferences). When editing points for a measurement, the user can drag the individual arcs to the desired curvature.
Measurement Filtering
We have added a field “Created By” for measurements and annotations. This is set to the User ID when a measurement or annotations is created.
To review “created by” in the measurement list, you can add the column.
To review the “created by” graphically, a new control “Filtering” was be added to the control panel. The heading includes these controls:
- A “Select” button. Press this and Mult-select mode starts and all measurements that match the current filtering are selected.
- A “Show” checkbox. Check this and only measurements that match the selection are displayed.
The body of the control is a list of filter descriptions on the left and a drop-down list of possible values on the right. “<all>” is included in the possible values.
Annotation Text Color
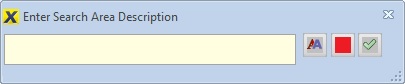
A separate color option has been added for annotation text. The color is set via a button in the description dialog. You can press that button to specify the color for the annotation text. This dialog is used by pattern search area annotations and text annotations
Extension Enhancements
A “Copy Window” is now available when editing standard extensions. This window allows you to browse through the variables for existing extensions and copy variables to the extension you’re working on.
Search capability has been added to the Standard Extension List Window. This allows you to find extensions based on text in the extension or its variables.
A “Paste” button has been added to the Extension Drop-down List Properties Window. Drop-down rows can now be transferred from Excel or any other applications that can copy CSV data to the clipboard. The data should be in 2 columns. The first is the row description. The second is the row value. Select the two columns for the desired rows in the CSV application and copy them to the clipboard. In the Extension Drop-down List Properties Window, simply press the “Paste” button. The rows will be added to the end of the list.
Measurement List Enhancements
- Extension List columns can now be totaled
- A preference has been added to allow column headings to be included when you drag & drop or copy & paste a rectangle of cells.
- A preference has been added to display a simple description for total rows (“XXXXXX” rather than “XXXXXX Total”). This is useful for using bid codes and total rows in a spreadsheet.
Named Views Control
A new control in the control panel allows you to name and save views. Then you can quickly open them in the main window or in an extra drawing window.
Quick Takeoff from Extra Drawing Windows
You can now do Quick Takeoff from extra drawing windows. This allows you to get dimensions from drawings other than the one in the main window.
One Point Lines
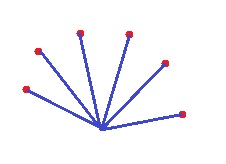
A user wanted to easily draw multiple straight lines from a common hub point to multiple end points. This is useful in low voltage wiring where the wires can go in a straight line. We implemented the following solution:
- Add a new ribbon/tool bar button “One Point Lines”. It turns on/off like Two Point Lines and Two Point Rectangles.
- User clicks a point at the hub.
- User selects One Point Lines.
- Each time the user clicks on a point, it creates a disconnected group of two points, one at the hub and one where they clicked.
Many times, the lines are being drawn to points that are part of an existing count measurement. For example they might count all the security cameras for a floor then want to digitize wire runs from a control center to each camera. They can do that as follows:
- User creates the count measurement first (for the cameras)
- User starts a new measurement for the wire runs.
- User clicks on the control center to create the hub point.
- User selects One Point Lines
- User right-clicks on the camera measurement. Because we’re in One Point Line mode, and they right-click on a point for an existing measurement, the context menu includes an option to ‘Draw lines to all “XXXX” points” Where XXXX is the name of the measurement they right-clicked.
- The user selects that option and one point lines are drawn from the hub to all the points.
Batch Print Select
A button has been added to the batch print selection dialog to select all drawings that have measurements or annotations. Drawings with measurements or annotations are displayed with a bold font.
Line Length on Grid Extensions
A new calculated variable “LineLen” has been added. It provides the total length of all the separating lines passing through the measurement area (both horizontal and vertical). Imagine an irregularly shaped concrete surface divided by a crisscross of saw cuts. This would be the total length of the saw cuts.
Miscellaneous
- The Not to Scale Length Entry dialog is now modeless
- The Riser Length Entry dialog is now modeless
- The “Created by” property was added to measurements and annotations. This information is available via columns in the measurement list.
- Batch importing of PDF files now creates PDF files rather than TIFF files.
- you can now open protected PDF files (if you know the password)
- Image display has been improved
- Image enhancement settings are now saved by drawing and page
- Excel formulas using bid codes are now available in advanced

